
How much food you waste
When you mark items as Used up or Thrown away, Spotrebio works out how much food – and money – ends up in the bin. The full statistics are in Settings → Statistics. The Overview also shows a This month card (once you use up or throw away something this month) – tap it to open them too.
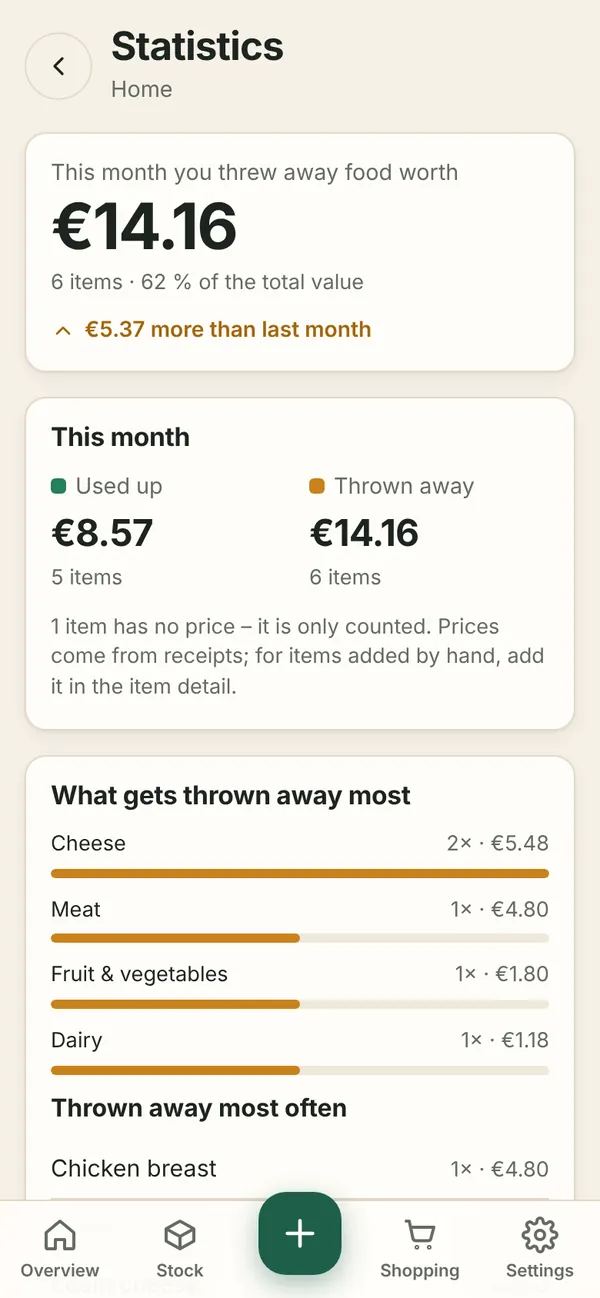
What you see
- How much you threw away this month in euros and items, its share of the total value and a comparison with last month.
- What gets thrown away most – groups such as bread, dairy or fruit & vegetables, and the actual products.
- Monthly trend – used up and thrown away side by side. Hover or hold a month for exact numbers; there is a table below the chart too.
Where prices come from
- From the receipt – the line price goes with the item. When you use up only part of it, the proportional part of the price counts.
- By hand – in the item detail, field Price (€).
- Without a price we estimate it from the last purchase of the same product (same barcode or name).
- Items without any price are only counted.
Most wasted food is bread, dairy and vegetables. Try buying less of them at once – and set a reminder 1 day ahead too.
The free plan shows the current month, Premium the last year.